Zinc Diecasting Alloys
Mechanical Properties
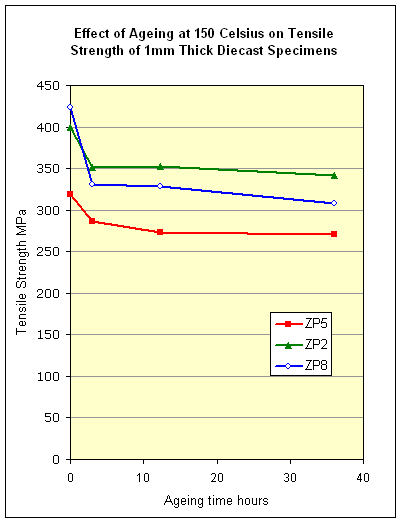
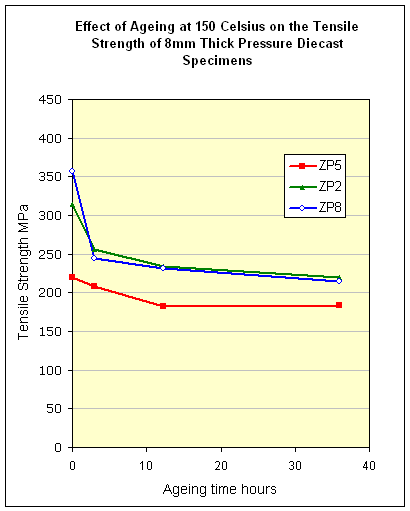
The mechanical properties of zinc alloy diecastings depend not only on alloy composition but also on casting conditions that affect the cooling rate. Conditions that promote rapid cooling in the die give the highest strength and hardness. Hence thin wall sections are proportionally stronger than thick. The tensile properties in the table of “Nominal Properties” below represent typical values for a sound casting around 2mm thick. Properties at different thicknesses can be judged from subsequent tables. The nominal properties are “original” values measured about five to eight weeks after casting. Properties change over time; very slowly at ambient temperatures, or more quickly at elevated temperatures. For alloys ZP3, ZP5 and ZP8 tensile strength and hardness decline while elongation increases. The elongation figure for ZP2 tends to fall over the first few weeks or months of room temperature ageing, after which it begins to increase slowly.
The relative performance of zinc alloys and other common materials are shown in the “Comparison with Alternative Materials” section.
The properties in the various tables below were obtained from a variety of different studies using test specimens of differing designs made under differing conditions. Caution should be taken when comparing the results from different sets of results unless the test specimens and test conditions are identical. Nevertheless despite the potentially wide differences in the casting conditions used for the various specimens tested, the as cast tensile strengths are surprisingly consistent for specimens of similar thickness. It should be born in mind however that the various investigators would have made sure that the test specimens were “sound”. Practically all zinc alloy diecastings contain some porosity, and “sound” is therefore not an absolute term. In zinc pressure die-casting, the porosity originates from two sources. Firstly, from trapped air that is unable to escape from the runner system plus mould which are themselves sealed and filled by molten metal in milliseconds. Secondly, shrinkage porosity is naturally formed as the hot liquid metal turns to its cooled solid state. Provided the porosity level is between, say, 1% and 5% and the individual pores are very small it is not significantly weakening. The actual distribution of porosity is at least as important as the nominal percentage porosity. As a result designers and diecasters should attempt to ensure soundness in strength critical areas of castings, porosity elsewhere is not so important, at least not from a structural integrity point of view.
With the increasing use of computer-aided engineering has come a demand for closer specification of materials properties. In the past simple statements of strength values were considered adequate without statement of the specimen dimensions and the test conditions. As a result of this change in demand the properties of zinc diecasting alloys and many other materials are currently undergoing re-evaluation. In the tables below those property values that are related to a fully specified test are shown in bold font.
Because zinc is a low melting point material, zinc alloy castings are liable to creep. (Creep is defined as the time-dependent strain that takes place under constant load.) Where zinc alloy diecastings are to be employed in situations where they experience long term loading, especially at elevated temperatures, the effects of creep may need to be taken into account. The creep resistance of alloys ZP8 and ZP2 are superior to that of ZP5, which in turn is superior to ZP3. Information that will allow estimation of the amount of creep deformation that will occur to a proposed casting design, under a given set of load, temperature and design life parameters is included in the Creep Properties section.
Reference 2
Nominal Mechanical Property Values
As Pressure Diecast, Tested at 20o Celsius.
Property values that are related to a fully specified test are shown in bold.
| Alloyother names | ZP3Alloy 3, Zamak3, ZP0400, ZnAL4 | ZP5Alloy 5, Zamak5, ZP0410, ZnAl4Cu1 | ZP2Alloy 2, Zamak2, ZP0430, ZnAl4Cu3 | ZP8ZA8, ZP0810, ZnAl8Cu1 | GDSLZP0730, ZnAl7Cu3 | Acuzinc5ZP0350, ZnAl3Cu5 | EZAC | HF alloy |
| Mechanical Properties | ||||||||
| Ultimate Tensile Strength: (MPa) (1) (6) | 315 | 331 | 397 | 386,8 | 387 | 407,79 | 414 | 276 |
| Yield Strength – 0.2% Offset: (MPa) (1) (6) | 276 | 295 | 360 | 318,6 | 315 | 337,84 | 393 | 234 |
| Elongation: % in 70mm (1) (2) (6) | ||||||||
| ε at UTS | 2,37 | 3,09 | 2,21 | 2,53 | 1,4 | |||
| ε at rupture | 7,73 | 3,43 | 5,99 | 3,41 | 1,5 | 6 | 1 | 5,3 |
| Modulus of Elasticity (Young): (GPa) (1)(4)(6) | 84,3 | 84,5 | 84,4 | 82,7 | 84 | 85 | 84,3 | |
| Shear Strength: (MPa) (7) | 214 | 262 | 317 | 275 | 245 | 280 | ||
| Poison coefficient (8) | 0,27 | 0,27 | 0,27 | 0,29 | ||||
| Hardness: Brinell (1) (6) | 97 | 114 | 130 | 95-110 | 119 | 115 | 140 | 93 |
| Impact strength | ||||||||
| Charpy Unnotched 20°C: J/cm2 (6) | 116 | 131 | 96 | 162,5 | 95 | |||
| Charpy Notched 20°C: J/cm2 (6) | 4 | 5 | 9 | |||||
| Fatigue Strength Rotary Bend (MPa) (3) (7) | ||||||||
| 5×10⁸ cycles | 48 | 57 | 59 | 103 | ||||
| 1×10⁷ cycles | 81 | 86 | 104 | 63 | 139 | |||
| Compressive Yield Strength: MPa (5) | ||||||||
| 0.2% Offset: MPa | 274 | 199 | 257 | 233 |
Notes:
(1) Flat test specimen, thickness 1,5mm; Property measured 8 weeks after casting. Test speed 10mm/minute.
(2) Strain measured with extensometer. L0 =70 for alloy 2, 3, 5, ZA8 and GDSL. L0=50mm for other alloys.
(3) Fatigue test sample diameter = 5,55mm. Fatigue limit determined with staircase method
(4) Young modulus of elasticity calculated from stress strain graph.
(5) The test specimen is a cylinder of 0.24” diameter and 0.48” height. The cylinders were machined from diecast impact test samples. Test speed: 1,1 MPa/sec. Strain is based on crosshead displacement.
(6) Umicore R&D (ref.5)
(7) ILZRO (ref.3)
(8) Umicore R&D/Brescia Univ. (ref. 6)
Stress vs Strain Curves
Mechanical Properties vs Test Temperature
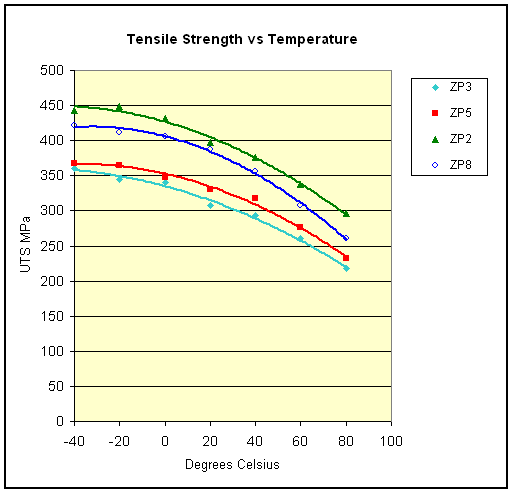
Tensile Strength (MPa) vs Test Temperature
Thickness 1.5 mm, Ageing 8 weeks, Lo 70mm,
Test speed 10mm/min, Specimen cooled in air
| TemperatureoCelsius | ZP3 | ZP5 | ZP2 | ZP8 |
| 80 | 218 | 232 | 296 | 260 |
| 60 | 260 | 277 | 338 | 308 |
| 40 | 293 | 317 | 376 | 356 |
| 20 | 308 | 331 | 397 | 387 |
| 0 | 340 | 347 | 431 | 406 |
| -20 | 345 | 365 | 449 | 412 |
| -40 | 360 | 368 | 443 | 422 |
The above table is illustrated graphically below
The Effect of Test Temperature on the
Mechanical Properties of Alloys ZP3 and ZP5
|
Property
|
TemperatureoCelsius
|
ZP3
|
ZP5
|
|
UTS MPa
|
95
|
200
|
250
|
|
40
|
250
|
300
|
|
|
20
|
280
|
340
|
|
|
0
|
300
|
380
|
|
|
-40
|
320
|
380
|
|
|
Elongation % F break
|
95
|
15
|
12
|
|
40
|
8
|
6
|
|
|
20
|
5
|
4
|
|
|
0
|
4.5
|
4
|
|
|
-40
|
2.5
|
1.5
|
|
|
Impact Strength J/cm26.18mm square bar Un-notched
|
95
|
135
|
143
|
|
40
|
140
|
150
|
|
|
20
|
140
|
145
|
|
|
10
|
100
|
135
|
|
|
0
|
25
|
130
|
|
|
-10
|
11
|
60
|
|
|
-20
|
8
|
12
|
|
|
-40
|
7
|
8
|
|
|
Impact Strength J/cm26.18mm square bar 2mm 45o V notch
|
70
|
11
|
12
|
|
20
|
2.9
|
4.1
|
|
|
0
|
1.7
|
2.2
|
|
|
-25
|
1.4
|
1.5
|
|
|
-55
|
1.2
|
1.1
|
|
|
Hardness VPN
|
95
|
43
|
62
|
|
40
|
68
|
89
|
|
|
20
|
82
|
90
|
|
|
0
|
82
|
100
|
|
|
-20
|
87
|
105
|
|
|
-40
|
91
|
107
|
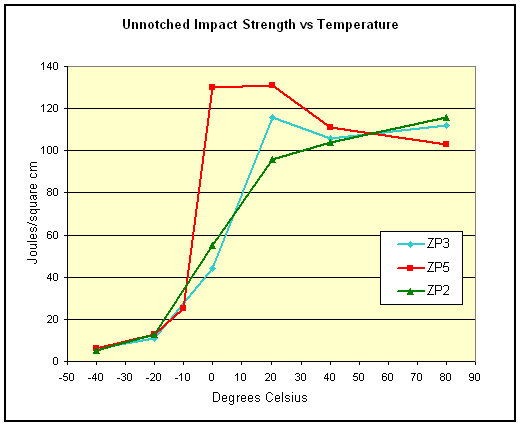
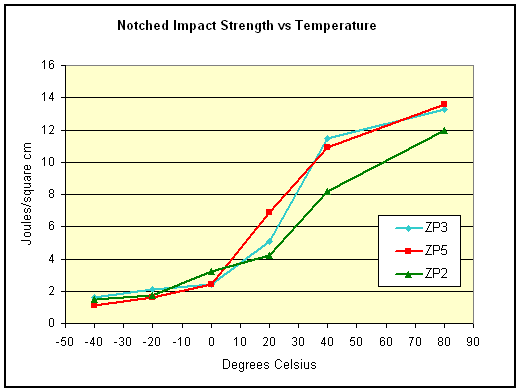
The Effect of Test Temperature on the Impact Strengths of
Alloys ZP3, ZP5 and ZP2
|
Property
|
TemperatureoCelsius
|
ZP3
|
ZP5
|
ZP2
|
|
Impact Strength J/cm2
6.35mm square bar Unnotched (0.40cm2) |
80
|
112
|
103
|
116
|
|
40
|
106
|
111
|
104
|
|
|
20
|
116
|
131
|
96
|
|
|
0
|
44
|
130
|
55
|
|
|
-10
|
25
|
|||
|
-20
|
11
|
13
|
13
|
|
|
-40
|
6
|
6
|
5
|
|
|
Impact Strength J/cm2
6.35mm square bar 2mm 45o V notch |
80
|
13.3
|
13.6
|
12
|
|
40
|
11.5
|
10.9
|
8.2
|
|
|
20
|
5.1
|
6.9
|
4.2
|
|
|
0
|
2.4
|
2.4
|
3.2
|
|
|
-20
|
2.1
|
1.6
|
1.75
|
|
|
-40
|
1.6
|
1.1
|
1.5
|
The Effect of Test Temperature on the Impact Strengths of
Alloys ZP3, ZP5 and ZP2
6.35mm square bar un-notched (0.40cm2)
6.35mm square bar 2mm 45o V notch
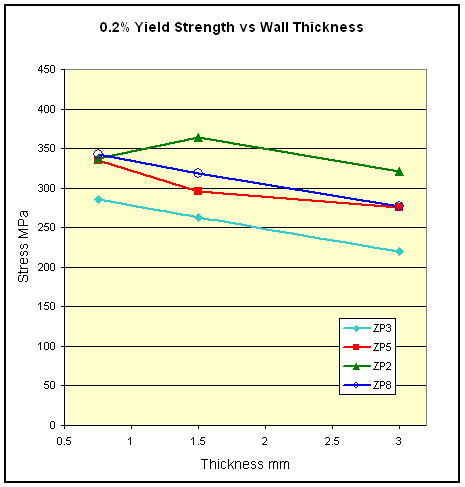
Tensile Properties vs Wall Thickness
Tensile Strength (MPa) vs Wall Thickness
| ZP3 | ZP5 | ZP2 | ZP8 | ||
| 0.76mm | As Cast | 333 | 374 | 416 | 421 |
| Aged | 296 | 327 | 345 | 394 | |
| 1.52mm | As Cast | 301 | 337 | 387 | 374 |
| Aged | 274 | 301 | 356 | 360 | |
| 2.14mm | As Cast | 276 | 312 | 353 | 369 |
| Aged | 251 | 275 | 329 | 353 | |
Aged = 4hrs at 100oC
Alloy ZP3, Tensile Properties vs Wall Thickness
Specimens cooled in air, Aged 8 weeks, Lo 70 mm, Test speed 10 mm/min, 10 tests
|
Thickness
|
0.2% Yield Strength MPa
|
σ
|
UTSMPa
|
σ
|
Elongation% F Break
|
σ
|
Elongation% F max
|
σ
|
|
|
0.75mm (200C)
|
max
|
295
|
6.22
|
337
|
5.74
|
10.4
|
1.53
|
2.72
|
0.24
|
|
min
|
276
|
317
|
6.36
|
2.01
|
|||||
|
1.5mm (200C)
|
max
|
272
|
5.65
|
312
|
4.37
|
8.15
|
1.59
|
2.40
|
0.1
|
|
min
|
253
|
296
|
4.22
|
2.16
|
|||||
|
3mm (200C)
|
max
|
225
|
2.8
|
292
|
5.9
|
8.75
|
2.2
|
4.7
|
0.8
|
|
min
|
216
|
270
|
2.23
|
2.1
|
|||||
σ = standard deviation
Alloy ZP5, Tensile Properties vs Wall Thickness
Specimens cooled in air, Aged 8 weeks, Lo 70 mm, Test speed 10 mm/min, 10 tests
|
Thickness
|
0.2% Yield Strength MPa
|
σ
|
UTSMPa
|
σ
|
Elongation% F Break
|
σ
|
Elongation% F max
|
σ
|
|
|
0.75mm (200C)
|
max
|
342
|
4.6
|
387
|
4.7
|
4.4
|
0.7
|
2.4
|
0.2
|
|
min
|
327
|
371
|
2.0
|
1.7
|
|||||
|
1.5mm (200C)
|
max
|
303
|
7.0
|
336
|
3.1
|
5.05
|
1.05
|
4.46
|
0.88
|
|
min
|
288
|
317
|
2.17
|
2.07
|
|||||
|
3mm (200C)
|
max
|
280
|
2.9
|
333
|
8.2
|
7.1
|
1.6
|
6.5
|
1.4
|
|
min
|
272
|
311
|
1.8
|
1.7
|
|||||
σ = standard deviation
Alloy ZP2, Tensile Properties vs Wall Thickness
Specimens cooled in air, Aged 8 weeks, Lo 70 mm, Test speed 10 mm/min, 10 tests
|
Thickness
|
0.2% Yield Strength MPa
|
σ
|
UTSMPa
|
σ
|
Elongation% F Break
|
σ
|
Elongation% F max
|
σ
|
|
|
0.75mm (200C)
|
max
|
338
|
15.4
|
430
|
14.8
|
9.5
|
2.4
|
1.8
|
0.2
|
|
min
|
336
|
386
|
1.6
|
1.1
|
|||||
|
1.5mm (200C)
|
max
|
378
|
9
|
403
|
4
|
8.51
|
1.3
|
4.84
|
1.4
|
|
min
|
351
|
392
|
4.10
|
1.2
|
|||||
|
3mm (200C)
|
max
|
330
|
7.4
|
376
|
10.8
|
4.5
|
2.6
|
4.3
|
1.2
|
|
min
|
313
|
345
|
1.0
|
1.0
|
|||||
= standard deviation
Alloy ZP8, Tensile Properties vs Wall Thickness
Specimens cooled in air, Aged 8 weeks, Lo 70 mm, Test speed 10 mm/min, 10 tests
|
Thickness
|
0.2% Yield Strength MPa
|
σ
|
UTSMPa
|
σ
|
Elongation% F Break
|
σ
|
Elongation% F max
|
σ
|
|
|
0.75mm (200C)
|
max
|
357
|
11
|
430
|
7
|
6.2
|
1.1
|
2.0
|
0.1
|
|
min
|
329
|
408
|
2.2
|
1.7
|
|||||
|
1.5mm (200C)
|
max
|
331
|
7
|
397
|
5
|
4.2
|
0.5
|
2.8
|
0.2
|
|
min
|
307
|
378
|
2.5
|
2.2
|
|||||
|
3mm (200C)
|
max
|
304
|
16
|
357
|
13
|
3.3
|
0.6
|
3.0
|
0.6
|
|
min
|
251
|
318
|
1.4
|
1.4
|
|||||
σ = standard deviation
The strength values in the four tables above are illustrated graphically below
Effect of Ageing at Ambient and Elevated Temperatures
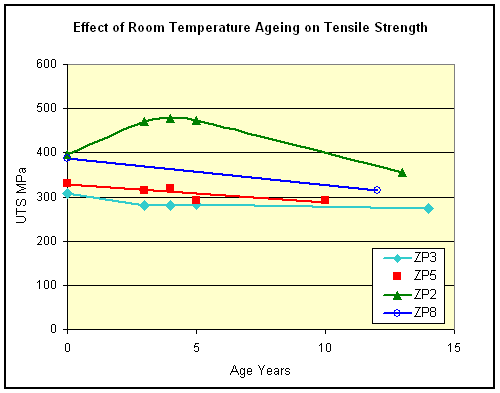
Effect of Ageing at Room Temperature on Tensile Strength (MPa)
1.5 mm thickness, Lo 70 mm, Test speed 10mm/min
|
Time
|
ZP3
|
ZP5
|
ZP2
|
ZP8
|
|
8 weeks
|
308
|
331
|
397
|
387
|
|
3 years
|
281
|
314
|
471
|
|
|
4 years
|
281
|
320
|
477
|
|
|
5 years
|
282
|
314
|
474
|
|
|
10 years
|
|
293
|
|
|
|
12 years
|
|
|
|
314
|
|
13 years
|
|
|
356
|
|
|
14 years
|
274
|
|
|
|
The data in the table above is displayed graphically below
Effect of Ageing at Elevated Temperature
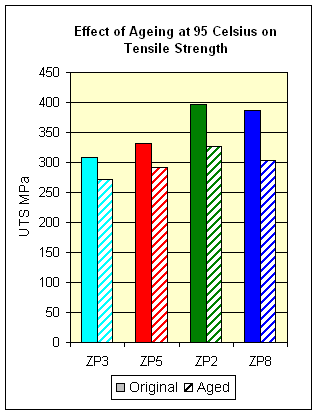
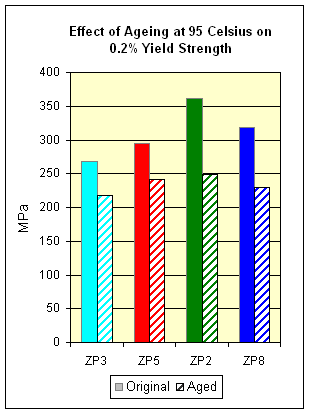
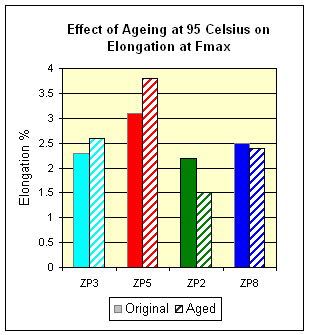
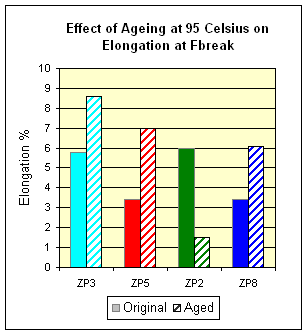
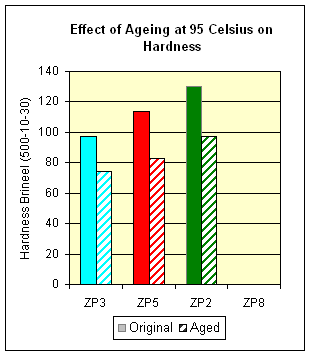
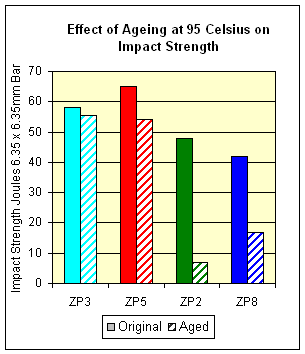
Properties After 10 Days at 95oC, tested at 20oC
Lo 70 mm, Speed 10mm/min, Specimen thickness 1.5mm
|
Short Designation
|
ZP3
|
ZP5
|
ZP2
|
ZP8
|
|
Tensile Strength MPa
|
271
|
291
|
326
|
303
|
|
Yield Stress (0.2% offset)
|
218
|
241
|
249
|
230
|
|
Elongation % F break
|
8.6
|
7
|
1.5
|
6.1
|
|
Elongation % F max
|
2.6
|
3.8
|
1.5
|
2.4
|
|
Hardness Brinell (500-10-15)
|
74
|
83
|
97
|
|
The figures in the above table are presented graphically below
Effect of Ageing at Room Temperature on
Tensile Strength vs Test Temperature (Mpa) of ZP3 and ZP5
|
Test
Temperature
oC
|
ZP3
|
ZP5
|
||
|
Aged
6months
|
Aged
3 years
|
Aged
6 months
|
Aged
3 years
|
|
|
70
|
207.5
|
205.5
|
255.1
|
246.8
|
|
20
|
268.9
|
261.3
|
316.5
|
304.1
|
|
0
|
290.3
|
284.1
|
338.5
|
330.3
|
|
-25
|
310.3
|
302.7
|
356.5
|
347.5
|
|
-55
|
330.3
|
324.1
|
358.5
|
355.1
|
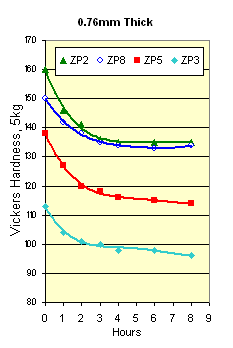
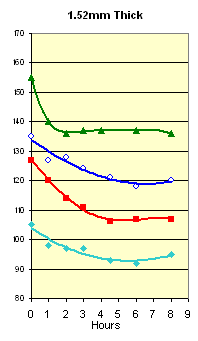
Vickers Hardness of Listed Alloys as a Function of Ageing Time at 100oC
for Three Thicknesses
Creep Properties
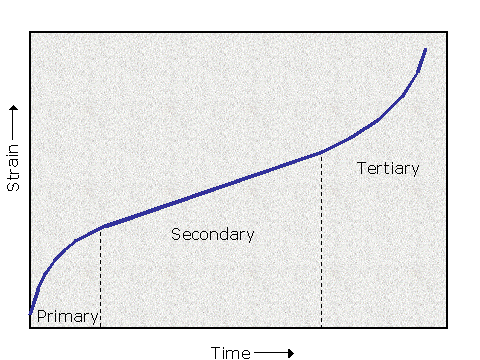
Creep is defined as the time-dependent strain that takes place under a given constant load. Three stages of creep can be distinguished.
1. Primary Creep -the creep strain that occurs at a diminishing rate.
2. Secondary Creep -the creep strain that shows a minimum and almost constant rate.
3. Tertiary Creep -the creep strain that exhibits an accelerating rate, usually leading to rupture.
The elongation (strain) behaviour of zinc alloys is a non-linear function of stress, service temperature, and time under stress. When zinc alloys are subjected to continuous loads, for any considerable period of time, actual tests or empirical mathematical relationships between elongation, stress, time at the given load, and service temperature must be used to predict the strain behaviour of each alloy. The elastic (Young’s) modulus of an engineering alloy, defined as stress divided by strain, is often used in design calculations. For zinc alloys, the value of the modulus depends upon stress, strain rate, and temperature, and is determined from short-term tensile tests. The value of the elastic modulus is valid only for the stress, strain rate, and temperature conditions under which it was measured. When short-term stress versus strain curves are available, the elastic modulus can be determined easily and elastic deflections estimated. However, under sustained loads, zinc alloys experience additional irreversible extension and the use of formulae, as set forth in this section is required to estimate the strains that result at given stresses.
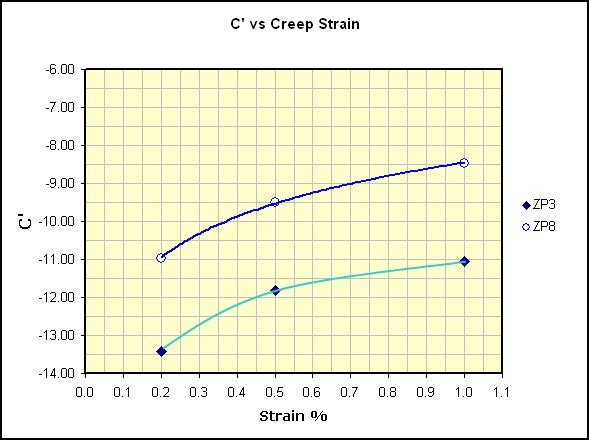
The creep behavior of pressure die cast alloys ZP3 and ZP8 with 2 mm wall section can be modeled using the equation below. It is valid over the temperature range of 25°C to 120°C for these alloys. The formula, which relates the maximum design stress σ (MPa) to temperature T (°K), service life t (time, seconds), and strain, was found to be:
Ln σ = C’+Q/RT – Ln t
n
Here, n is the stress exponent = 3.5
Q is the activation energy = 106kJ/mol
R is the gas constant = 8.3143 x 10⁻³ kJ/mol °K
C’ = a constant for the given allowable strain (varies with strain for each alloy, as shown below)
Using this equation, it is possible to calculate the permissible combinations of stress, temperature, and creep life for any creep strain within the range of 0.2 to 1%. The equation is valid for stresses up to 50 MPa and temperatures up to 120°C. (The equation has been found to give times to a given elongation that correlate well with all known experimental data).
Creep extension in most alloy systems can be highly inconsistent. Zinc is no exception, and apparently identical samples can vary from the mean creep life (or strain) by a factor of two. Thus whether the creep life to a given strain is determined from actual tests or using the formula described previously, an additional factor of at least two should be applied to either the life or the strain to take into account such individual variations.
Service at elevated temperatures results in aging of all zinc alloys. When the effect of room temperature aging on creep strength of alloy 3 was investigated, it was found that creep strength decreased under both conditions. Testing under high loads showed that the creep strength decreased as much as 16% within two years of aging at room temperature or by heating at 75°C to 95°C for three days. It thus has been suggested that a factor of 0.8 be applied to permissible stress values computed from the equation given above.
The creep rates for alloy ZP5, up to 100°C, can be estimated by using the figures shown in this section for alloy ZP3 and adding 10°C to temperatures given. That is, alloy ZP5 provides approximately equivalent creep behavior at temperatures 10°C higher than those shown for Alloy ZP3.
Limited creep testing undertaken on alloy ZP2 indicates that its performance is equivalent to alloy ZP8. Research is continuing to identify C’ vs strain curves for alloys ZP5 and ZP2.

